- Data QC report that includes stats about read trimming and filtering, pair send stitching and chimera filtering.
- Taxonomy classification report and set of representative sequence file
- Classified OTU table with abundance information
- Phylogenetic Tree
- Alpha Diversity report that includes: Diversity tree, observed species and stats.
- Beta Diversity report that includes: Trees, Graph and Network diagrams; Distance matrices; PCoA plots
16s rRNA Data Analysis / Microbial Diversity Analysis
Welcome to 1010Genome, your trusted partner in uncovering the hidden world of microbial diversity through 16S rRNA sequencing analysis. Our state-of-the-art services are designed to empower researchers, healthcare professionals, and organizations in exploring the microbial communities that play a pivotal role in various fields.
What Is 16S rRNA Sequencing?
16S rRNA sequencing is a powerful tool for studying microbial communities. The 16S ribosomal RNA gene is present in all bacteria and archaea and contains regions of both high conservation and variability. By sequencing and analyzing this gene, we can identify and characterize diverse microbial species, allowing us to answer crucial questions in various fields, including: Microbiome Research, Disease Pathogenesis, and Environmental Science.

16s rRNA Importance and Applications
- 16s rRNA sequencing has been established for the identification and taxonomic classification of bacterial species.
- It can prove to be a method for the recognition of novel pathogens.
- Being the conserved gene in bacterial species it provides the identification of useful signature sequences and patterns.
- 16s rRNA sequencing can lead to the development of completely new species.
- The conserved variable regions facilitate sequencing and phylogenetic classification.
- Researchers can achieve species level sensitivity for metagenomic surveys of bacterial populations.
- In clinical microbiology, molecular identification based on 16s rDNA sequencing is applied fundamentally to bacteria whose identification by means of other types of techniques turns out difficult, or requires a lot of time.
16s rRNA Sequencing and Data Analysis

16s rRNA Short read libraries target variable V3 and V4 regions of 16s rRNA genes. Although, 16s rRNA sequencing is an amplicon sequencing technique, usually the environment or clinical samples are as clean and need expert hands to process and amplify 16s rRNA genes. Our 16s rRNA sequencing service makes sure that your precious samples are managed in the best possible manner to generate quality sequencing data. Our 16s rRNA sequencing service can help achieve species level sensitivity for biodiversity analysis of bacterial population.
16s rRNA Bioinformatics Analysis Overview
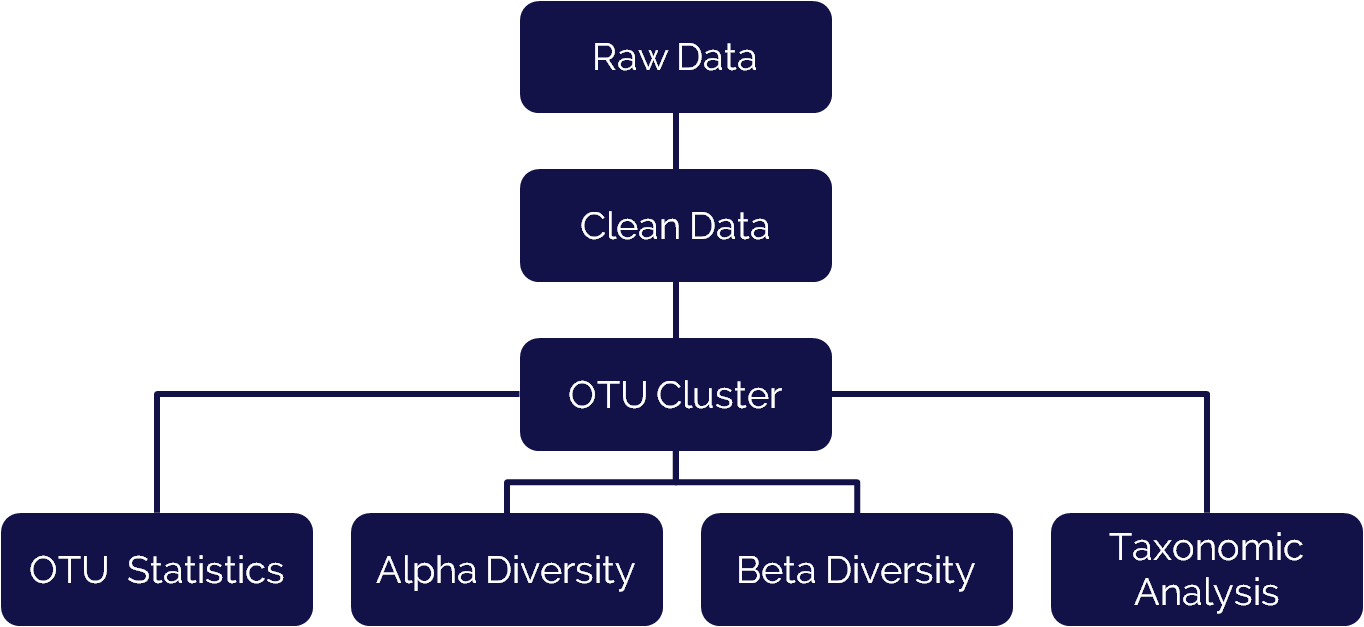
16s rRNA sequencing data analysis requires deep understanding of various steps to be able to generate precise information about biodiversity or phylogeny. A typical data analysis overview for 16s rRNA data analysis pipeline is represented here.

Why Choose 1010Genome for 16S rRNA Sequencing Analysis?

Key Deliverables for 16s rRNA Data That We Offer
Ready to Explore Microbial Worlds?
Embark on a journey of discovery with 1010Genome's 16S rRNA sequencing analysis services. Whether you're a researcher in academia, a biotech company, or a healthcare institution, our services can uncover the microbial secrets hidden within your samples.

